Pie Charts
Sample Answer: the comparison of different kinds of energy production of France in two years
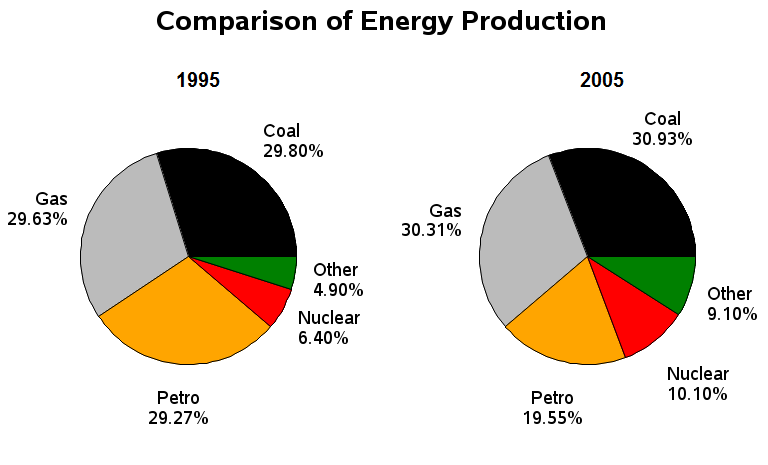
The two pie charts illustrate the proportion of five types of energy production in France in 1995 and 2005.
Overall, in both years, the most significant sources of energy were gas and coal, which together accounted for over half the production of energy, while nuclear and other kinds of energy sources generated the least amount of energy in France. In all types of energy production there was only minimal change over the 10 year period.
Energy produced by coal comprised of 29.80% in the first year and this showed only a very slight increase of about a mere 1% to 30.9% in 2005. Likewise, in 1995, gas generated 29.63% which rose marginally to 30.1% 10 years later.
With regards to the remaining methods of producing energy, there was an approximate 5% growth in production from both nuclear power and other sources to 10.10% and 9.10% respectively. Petrol, on the other hand, was the only source of energy which decreased in production from 29.27% in 1995 to around a fifth (19.55%) in 2025.