Two Different Charts
Sample Answer
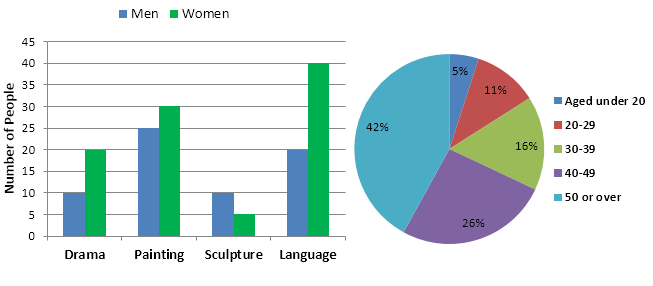
The bar chart below shows the numbers of men and women attending various evening courses at an adult education centre in the year 2009. The pie chart gives information about the ages of these course participants.
The bar chart compares the numbers of males and females who took four different evening classes in 2009, and the pie chart shows the age profile of these attendees.
It is clear that significantly more women than men attended evening classes at the education centre. We can also see that evening courses were much more popular among older adults.
According to the bar chart, drama, painting and language courses all attracted more women than men to the education centre in 2009. Language courses had the highest number of participants overall, with 40 female and 20 male students, while painting was a popular choice among both genders, attracting 30 female and 25 male attendees. The only course with a higher number of males was sculpture, but this course was token by a mere 15 people in total.
Looking at the page profile pie chart, we can see that the majority of people attending evening lessons were over 40 years of age. To be precise (确切地讲), 42% of them were aged 50 or more, and 26% were aged between 40 and 49. Younger adults were in the minority, with only 11% of students aged 20 to 29, and only 5% aged under 20.